概要
最近流行りのニューラルネットワーク(ディープラーニング)ですが、モデルがブラックボックスであり、どのようなモデルとなっているのか分からないのが1つのネックです。とりあえず、どのように学習されているのかをトレースできるようにするため、下記のような構成と学習過程の可視化ツールの構築にトライしました。
上図では、左図が学習回数と予測精度を、右図がニューラルネットワークの構成を表しており、エッジの太さが結合パラメータの大きさを示しています。また、学習によりエッジが太くなった場合は赤く、細くなった場合は青く表すことで、どのエッジが学習されたかが分かるようにしており、特定の結合が強くなっていっている傾向がご覧いただけると思います。
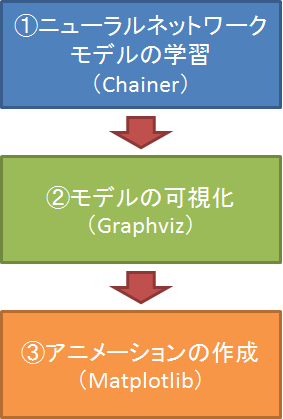
可視化手順の説明
上記図の作成までは下記の手順の通り、Chainerを使ったニューラルネットワークの構築からGraphvizを使った可視化・アニメーション化までを進めていきます。
以下の記事で説明しています。
アニメーションの作成(Matplotlib)
可視化ツールの作成
具体的に以下のような可視化ツールのファンクションを構築しました。
入力変数
以下5つの引数を受け取ります。
- trainer:Chainerで構築し学習させたtrainer
- neuralShape:積層化構造を配列で表記したもの
- out:logファイルやtrainerの保存データが格納されたフォルダのアドレス
- figsize:出力ファイルのサイズ(デフォルトは(9, 6))
- fileName:出力ファイルの名称(デフォルトはdefault.gif)
使い方
引数を関数に渡すと、自動的にアニメーションが作成・保存されます。trainerはget_trainerという関数を仮に定義しましたが、必要に応じて実装してください。
#必要な変数の定義
out = 'result'
neuralShape = [4, 5, 5, 5, 3]
figsize = (6, 4)
trainer = get_trainer(train, test, epoch=500, batch=30, seed=0, out=out, snap=10)

#アニメーション作成
createLearnAnimation(trainer, neuralShape, out, figsize=figsize, fileName="test.gif")
createLearnAnimationのソース
ソースコードの説明を今後入れていこうと思っていますが、とりあえず生で置いておきます。neuralVizは「モデルの可視化(Graphviz)」で紹介している記事から取得してください。
def createLearnAnimation(trainer, neuralShape, out, figsize=(9, 6), fileName="default.gif"):

    snap_list = glob.glob(out+"/trainer*")

    log = pd.read_json(out+'/log')

    fig = plt.figure(figsize = figsize)
    gs = gridspec.GridSpec(1, 3)

    plt.subplot(gs[0])
    plt.plot(log['epoch'], log['main/accuracy']*100, 'b-')
    plt.xlabel("epoch")
    plt.ylabel("accuracy")

    ax = plt.subplot(gs[1:])

    ax.tick_params(axis='x', which='both', top='off', bottom='off', labelbottom='off')
    ax.tick_params(axis='y', which='both', left='off', right='off', labelleft='off')

    ims = []

    for j, snap in enumerate(snap_list):

        print(snap)

        plt.subplot(gs[0])
        im = plt.plot(int(snap[-5:]), log[log.epoch==int(snap[-5:])].iloc[0]['main/accuracy']*100, 'ro')
        plt.subplot(gs[1:])

        serializers.load_npz(snap, trainer)
        model = trainer.updater.get_optimizer('main').target.predictor

        W1 = model.l1.W.data
        W2 = model.l2.W.data
        W3 = model.l3.W.data
        W4 = model.l4.W.data

        Wlist = [W1, W2, W3, W4]

        g, matrix, wmatrix = neuralViz(neuralShape, plot=False, Wlist=Wlist)

        if j == 0:
            wmatrix_old = wmatrix
        wchange = (wmatrix - wmatrix_old) / (wmatrix_old + 0.0000001)
        wchange /= abs(wchange).max() + 0.0000001

        edgeList = g.get_edge_list()

        for i in range(len(edgeList)):
            edge = edgeList[i]
            source = edge.get_source()
            dest = edge.get_destination()
            edge.set_penwidth(abs(wmatrix[source-1, dest-1])**2*0.3+0.01)

            if j == len(snap_list) - 1:
                print(snap_list[j])
            else:
                if wchange[source-1, dest-1] > 0:
                    edge.set_color("#{00:X}0000".format(int(wchange[source-1, dest-1]*255)))
                    edge.set_penwidth(edge.get_penwidth()+wchange[source-1, dest-1])
                else:
                    edge.set_color("#0000{00:X}".format(int(wchange[source-1, dest-1]*-255)))
                    edge.set_penwidth(edge.get_penwidth()-wchange[source-1, dest-1])

        im.append(plt.imshow(Image.open(io.BytesIO(g.create_png())), interpolation="spline36"))
        ims.append(im)

    ani = animation.ArtistAnimation(fig, ims, interval=200, repeat=False)
    ani.save(fileName, writer="imagemagick", fps=10)
まとめ
ニューラルネットワーク(ディープラーニング)の学習過程を可視化するツールを作成しました。今後、これをつかってドロップアウトや活性化関数等、いろんなパラメータの効果を検証していく予定です。